Multi-Table Filtering in DAX is a crucial technique that elevates your data modelling capabilities within Microsoft Power BI. DAX, or Data Analysis Expressions, is a robust language that empowers users to perform complex functions and refine their data dynamically.
A pivotal function in DAX is FILTER, which simplifies the application of conditions across different tables. In this article, we delve into how to effectively utilize the FILTER function to enhance your data analysis projects.
I learned some of the things discussed in this blog post from Power BI Bootcamp: Zero to Mastery course. If You join the course I will earn a commission.
Understanding DAX and the FILTER Function
DAX is a formula expression language used in Analysis Services, Power BI, and Power Pivot in Excel. It’s designed for data manipulation and an essential tool for creating complex, interactive dashboards.
The FILTER function in DAX is particularly useful for subsetting data within tables based on specific conditions. Here’s a simple syntax to understand it better:
FILTER(Table, Expression)Where ‘Table’ is the data source, and ‘Expression’ is the condition that must be met.
Setting Up Your Data Model

In our example, we have two tables: FactTable and DimTable. FactTable records transactions, each with a numerical value we want to sum. DimTable includes dimensions that describe the conditions of each transaction.
But!
In this case, we have a dimension in the Fact table – it happens. And we don’t have access or the authority to change the data model. So we need to use that condition in the Fact table to filter our data.
To better demonstrate this I have created a custom Excel with data. You can download it here.
Multi-Table Filtering in DAX
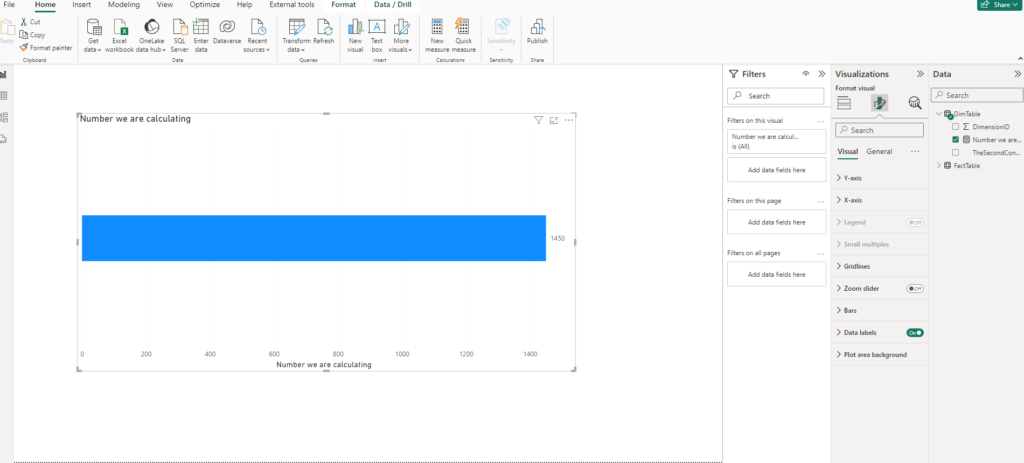
The measure we are dissecting is:
CALCULATE(
    SUM(FactTable[NumberWeAreCalculating]),
    FILTER(
        FactTable,
        FactTable[ConditionColumn] = "A"
    ),
    FILTER(
        DimTable,
        DimTable[TheSecondConditionWeNeed] = "Yes"
    )
)
This DAX formula sums up values from FactTable where two conditions, spread across two different tables, are met. Here’s how it works:
SUM(FactTable[NumberWeAreCalculating])calculates the total of numbers where subsequent FILTER conditions apply.- The first FILTER applies to
FactTable, ensuring only rows meetingSomeConditionWeNeedare considered. - The second FILTER checks
DimTableforTheSecondConditionWeNeedset to “Yes”.
Practical Applications and Benefits of Multi-Table Filtering in DAX

This approach is beneficial in scenarios like financial reporting, inventory management, and any situation requiring complex data filtration.
It provides a flexible, powerful way to derive insights by intersecting data from multiple sources.
Common Mistakes and Best Practices With Multi-Table Filtering in DAX
Common mistakes include overlooking table relationships or misapplying filter logic.
To avoid these, ensure your data model is correctly structured and relationships are well defined. Always test your DAX expressions to confirm they return the expected results.
Using DAX’s FILTER function to query across multiple tables can significantly enhance your analytical capabilities in Power BI. Experiment with different scenarios and see how multi-table filtering can provide deeper insights into your data.
Remember, DAX is powerful but requires practice and patience to master. Keep experimenting, and further resources to deepen your understanding.
Feel free to share your experiences and questions in the comments below.
I learned some of the things discussed in this blog post from Power BI Bootcamp: Zero to Mastery course. If You join the course I will earn a commission.