Often when I’m preparing a dataset in Power BI just importing tables from sources does not suffice. Because of the intricate requests from the business side – I continuously need to use data manipulation with SQL.
In this blog post, I will share how to make the best of an annoying situation with SQL.
Some of the things mentioned in this post I learned from the Zero to Mastery Academy. If You sign up through the links – I will earn a commission.
The setup
I have Power BI, and two tables imported directly from the databases. I’m importing them from 2 separate databases and they have a common column.
But!
There are NO unique values in the columns! Or in other words – there’s no single instance of a value in the column. There are multiple instances of the same value.
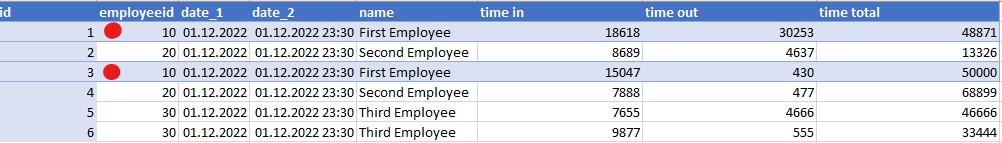
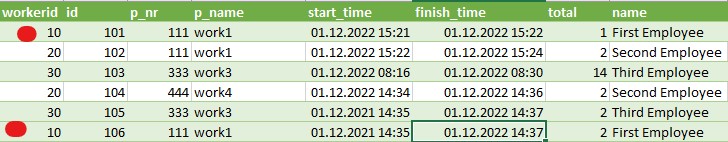
In essence – the computer doesn’t know with which values it should merge between the tables. Is it rows 1 and 1? Or rows 1 and 6? It just doesn’t have any way of knowing because it’s the same value – employee ID 10.
Whereas if the tables just had one row each with employee ID and worker ID 10 – it would have no problem merging the data.
If You are already familiar with Power BI, You know this can cause a headache. Meaning, hard to form a one-to-many relationship between the tables. You can read up on relationships in Power BI in this article.
If You can’t form one-to-many or many-to-one type relationships – Your visuals might not work as expected or desired. This was the case for me in this scenario.
I needed to compare the data from these two different tables with one another.
Potential solutions
After I understood that there are no unique values and I can’t merge the tables properly – there were basically 2 options left on the table.
- Use Many-to-many relationships between the tables.
- Manipulate the data with a SQL query and import it into a new table.
- 3rd option would be to write some Power Query or DAX – but I’m personally better at SQL.
Many-to-many relationships in Power BI
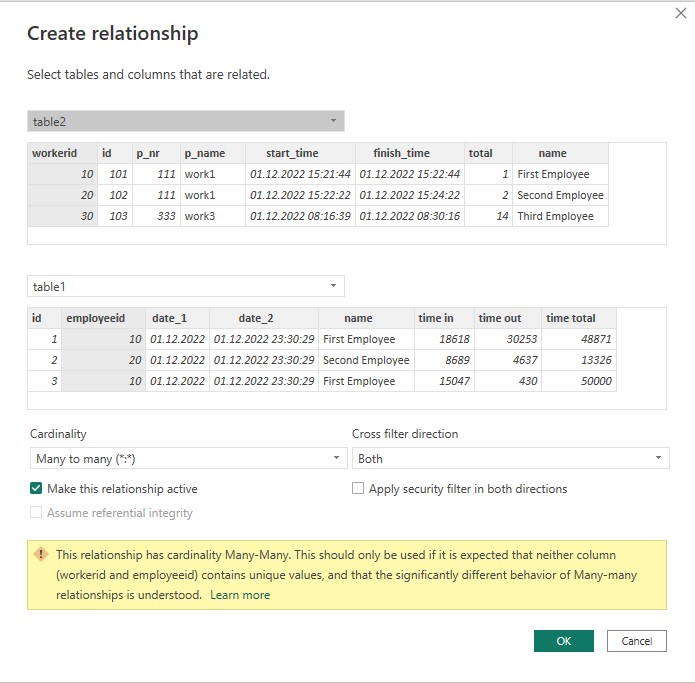
Let’s be clear – I don’t really use many-to-many relationships if at all possible.
But I gave it a shot anyway. What makes this specific case even more difficult – I also had other filters from the tables on the visual as well.
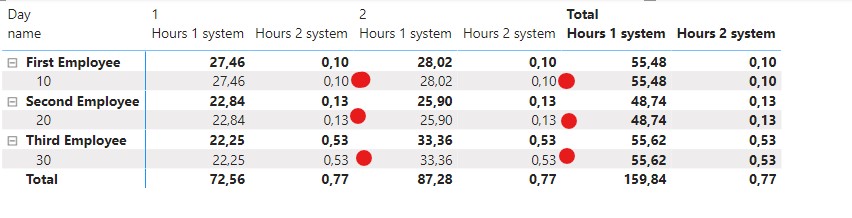
As You can see – it only worked with one of the figures I needed to display.
Manipulating data with SQL

I had no other choice – I had to put on my SQL cap and start coding (Googling and ChatGPTing, and yes that’s a thing now).
Here’s the full query:
SELECT
    t1.employeeid,
    t1.date_2 AS date,
    SUM(t1.time_in) / 3600 AS hours_worked_system1,
    SUM(t2.total) / 60 AS hours_worked_system2
FROM
    table1 AS t1
    JOIN (
        SELECT
            workerid,
            DATE(start_time) AS start_date,
            SUM(total) AS total
        FROM
            database2.table2
        GROUP BY
            workerid,
            DATE(start_time)
    ) AS t2 ON t1.employeeid = t2.workerid AND DATE(t1.date_2) = DATE(t2.start_date)

GROUP BY
    t1.employeeid,
    t1.date_2;
Line by Line Explanation of the SQL

SELECT
    t1.employeeid,
    t1.date_2 AS date,
    SUM(t1.time_in) / 3600 AS hours_worked_system1,
    SUM(t2.total) / 60 AS hours_worked_system2
This line specifies the columns to be returned in the result set. We are selecting four columns:
employeeid: The ID of the employee.date_2: The date of work done by the employee.hours_worked_system1: The number of hours worked by the employee with the first system, calculated by dividing the total time in seconds by 3600.hours_worked_system2: The total number of hours worked by the employee with the second system, calculated by dividing the total summary time by 60.
Sidenote – I needed to calculate the time because one table had it in seconds and the other in minutes. But I had to display hours. You can definitely do this in Power BI. But I thought – if I’m going to code some SQL why not fix it immediately?
FROM WHERE?
FROM database1.table1 AS t1This line specifies the table from which the data is being selected. Here, the table table1 from the database1 schema is being used. We are also using the alias t1 for this table, which is used later in the query. I’m using t1 just to minimize the code written and thus optimize it for performance.
Putting the tables together
    JOIN (
        SELECT
            workerid,
            DATE(start_time) AS start_date,
            SUM(total) AS total
        FROM
            database2.table2
        GROUP BY
            workerid,
            DATE(start_time)
    ) AS t2 ON t1.employeeid = t2.workerid AND DATE(t1.date_2) = DATE(t2.start_date)
This line joins the table1 table with the subquery. The subquery selects the total time worked (total) by each employee (workerid) on each day (start_date) from the table2 table.
The JOIN condition connects the employeeid column from the table1 table to the workerid column from the subquery, and the date_2 column from the table1 table to the start_date column from the subquery.
Making the data nice

GROUP BY
    t1.employeeid,
    t1.date_2;
This line groups the result set by employeeid and date_2 columns.
Code Output
The output of the code will be a table with four columns: employeeid, date, hours_worked_system1, and hours_worked_system2. Each row will represent the hours worked by an employee on a particular date in each of the systems.
Something like this:
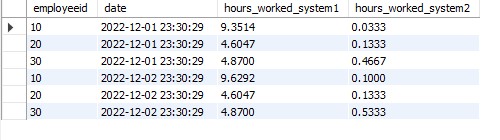
Everything is nicely in one table – even the date! Just what I needed to display the data properly as requsted.
The visual change in Power BI
Now we can finally display the data like we need and we can see the differences. In this case, I needed to see what is the difference between the systems each day of the month.
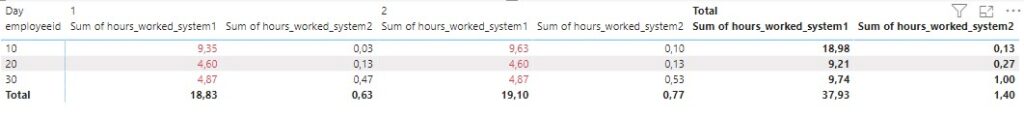
This is a full example of how data manipulation with SQL works.
Some of the things mentioned in this post I learned from the Zero to Mastery Academy. If You sign up through the links – I will earn a commission.
Ian Altosaar