In the world of database management, SQL views stand out as a powerful tool for simplifying complex queries and enhancing data analysis. Particularly, when combined with advanced techniques like CROSS APPLY and conditional sorting, views can significantly streamline data manipulation and reporting tasks. This post delves into a sophisticated method of creating SQL views that leverage these techniques, offering a practical guide for developers and analysts alike.
Some of the things mentioned in this post I learned from the Zero to Mastery Academy. If You sign up through the links – I will earn a commission.
Understanding the Basics of CROSS APPLY and Conditional Sorting
SQL views are essentially saved queries that allow you to manage and access complex data with ease. They act as virtual tables, presenting data from one or more tables in a simplified format.
The CROSS APPLY operator in SQL Server is particularly useful for applying a table-valued function to each row in a table, effectively unpivoting data for more dynamic analysis. Conditional sorting, achieved through CASE statements, further enhances data organization by allowing custom sort orders based on specific criteria.
Detailed Breakdown of the SQL View With CROSS APPLY and Conditional Sorting
The provided SQL view example showcases an advanced implementation that combines CROSS APPLY with conditional sorting to organize and analyze data across different age groups and years. It highlights:
- How to select and alias columns.
- Implementing
CASEstatements for dynamic sorting based on age groups and years. - Using
CROSS APPLYwith aVALUESclause to efficiently unpivot and transform data for analysis.
Here’s the full SQL code block:
ALTER   VIEW [dbo].[ViewName] AS

SELECT
    [Region],
    AgeGroup,
	CASE
        WHEN Unpivoted.AgeGroup = '7-12' THEN 1
        WHEN Unpivoted.AgeGroup = '13-19' THEN 2
        WHEN Unpivoted.AgeGroup = '20-26' THEN 3
    END AS AgeGroupSort,
    CASE
        WHEN Unpivoted.Year = '2019' THEN 1
        WHEN Unpivoted.Year = '2020' THEN 2
        WHEN Unpivoted.Year = '2021' THEN 3
        WHEN Unpivoted.Year = '2022' THEN 4
        WHEN Unpivoted.Year = '2023' THEN 5
    END AS YearSort,
    Year,
    NumberWeAreCounting
FROM
    [dbo].[TableName]
    CROSS APPLY (
        VALUES
            ('7-12', '2019', [7-12 2019]),
            ('13-19', '2019', [13-19 2019]),
            ('20-26', '2019', [20-26 2019]),
            ('7-12', '2020', [7-12 2020]),
            ('13-19', '2020', [13-19 2020]),
            ('20-26', '2020', [20-26 2020]),
			('7-12', '2021', [7-12 2021]),
            ('13-19', '2021', [13-19 2021]),
            ('20-26', '2021', [20-26 2021]),
            ('7-12', '2022', [7-12 2022]),
            ('13-19', '2022', [13-19 2022]),
            ('20-26', '2022', [20-26 2022]),
			('7-12', '2023', [7-12 2023]),
            ('13-19', '2023', [13-19 2023]),
            ('20-26', '2023', [20-26 2023])
    ) AS Unpivoted(AgeGroup, Year, NumberWeAreCounting)
GO
Why Use Conditional Sorting in your SQL Views?
Imagine you have to display your data in a visualization tool like Power BI for example.
And you would like to order it in a specific way. You want the age group of 7-12 to be the first in line always. And you also have values like 13-19.
In our human minds, it makes sense that the age group 7-12 comes before 13-19. But computers are different. They compute or read in 1s and 0s. To them, 7 comes after 1. Or 7-12 is after 13-19.
To mitigate this issue, we can add conditional columns with conditional sorting as in the query above.
In essence, we are telling the computer that we want 7-12 to have a number of 1. And 13-19 have a number of 2. And then later we can sort them by that specific column. Thus accomplishing our task of telling the computer that 7-12 is actually before 13-19.
Practical Application: Example Data and Analysis With CROSS APPLY and Conditional Sorting
To illustrate the view’s practical utility, we discuss creating a sample dataset and analyze how the view processes and presents this data.
Download the sample Excel .xlsx file here.
I reduced the sample data on purpose. Adjust the script accordingly.
Basically, we have a situation where our data “kind of fits” our visualization purposes but we would like to add some features to make it more readable. For example, display the data using the age group and year separately. Currently, we cannot achieve this:
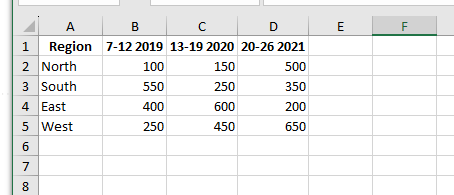
Enter SQL…
Until now we have selected and sorted our data. But we also want to make it usable for our purposes.
This is achieved with CROSS APPLY (I shortened the query):
CROSS APPLY (
        VALUES
            ('7-12', '2019', [7-12 2019]),
            ('13-19', '2020', [13-19 2020]),
            ('20-26', '2021', [20-26 2021])
    ) AS Unpivoted(AgeGroup, Year, NumberWeAreCounting)
We are taking the first part of the column name and assigning it to the new column “AgeGroup”. Then we are taking the second part of the column name and giving it a new home in the column “Year”.
And finally, we are also selecting the number we so desperately want to display to others.
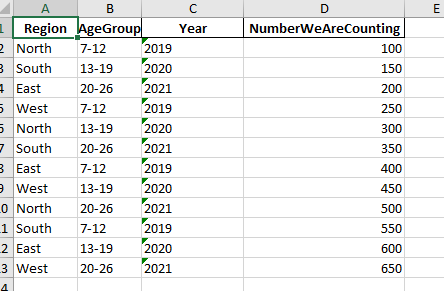
If the data Gods have smiled upon us – we can now visualize our data with ease.
Some of the things mentioned in this post I learned from the Zero to Mastery Academy. If You sign up through the links – I will earn a commission.