SELECTEDVALUE in DAX is a crucial function in the Power BI formula language known as Data Analysis Expressions (DAX), which excels in crafting custom calculations and manipulating data.
This function adeptly pulls a single value from a column, given that the column’s context is narrowed down to one unique value. It proves especially valuable in reports that employ slicers to refine data.
I learned some of the things discussed in this blog post from Power BI Bootcamp: Zero to Mastery course. If You join the course I will earn a commission.
Business Scenario Introduction Where to Use SELECTEDVALUE in DAX
Consider a retail company dealing with a vast array of products organized into categories and sub-categories. Analysts often face challenges during sales reviews, particularly when trying to understand trends at different hierarchy levels using slicers.
The main issue arises when they cannot see which products or categories have been selected in the slicer. This is where SELECTEDVALUE becomes invaluable.
Detailed Explanation of the SELECTEDVALUE Function
The syntax of SELECTEDVALUE is:
SELECTEDVALUE (ColumnName [, DefaultValue])This function returns the value when there is one value in the context; otherwise, it returns the DefaultValue if specified, or BLANK by default.
It is ideal for scenarios where user selections need to be captured and displayed, differentiating it from VALUES, which returns all values in the column in the current context, and HASONEVALUE, which simply indicates whether there is one value.
Step-by-Step Solution Using SELECTEDVALUE in DAX
To address our business scenario:
(DAX for table 1)
Selected Product Name Product 1:=
VAR SelectedProduct = SELECTEDVALUE('Product'[SubCategory], "Multiple Products") --if multiple selections are made, we will just display "Multiple Products" to the user. Otherwise, we will display the Subcategory in this scenario.
RETURN SelectedProduct

(DAX for table 2)
Selected Product Name Product 2:=
VAR SelectedProduct = SELECTEDVALUE('Products_to_compare'[SubCategory], "Multiple Products")
RETURN SelectedProduct
If you paid attention to the DAX formula, you might have noticed one crucial point. We actually have 2 formulas and each of these is used on a separate table. This is useful when we need to compare two sets of anything (products, performance, people, salespeople, etc.) against one another.
Creating the Sample Excel Data
Let’s create an Excel spreadsheet that simulates the product hierarchy and associated sales data to illustrate the use of SELECTEDVALUE in Power BI. Here’s how the data structure will be set up:
Columns in the Excel Spreadsheet:
- ProductCategory: The top-level category of products.
- ProductCategory2: A secondary level of product categorization.
- SubCategory: More specific categorization of products.
- Sales: The sales figures for each sub-category item.
You can download the file here.
Further Steps to Use SELECTEDVALUE in DAX
Import the Excel file into Power BI and create the measures.
Importing Data
- Open Power BI Desktop.
- Get Data > Excel.
- Browse to the location of
ProductSalesData.xlsxand select the file. - Load the data into Power BI.
Visualizing the Data for a Friendly UX
After you have created the measures and picked a visual you should get something like this:
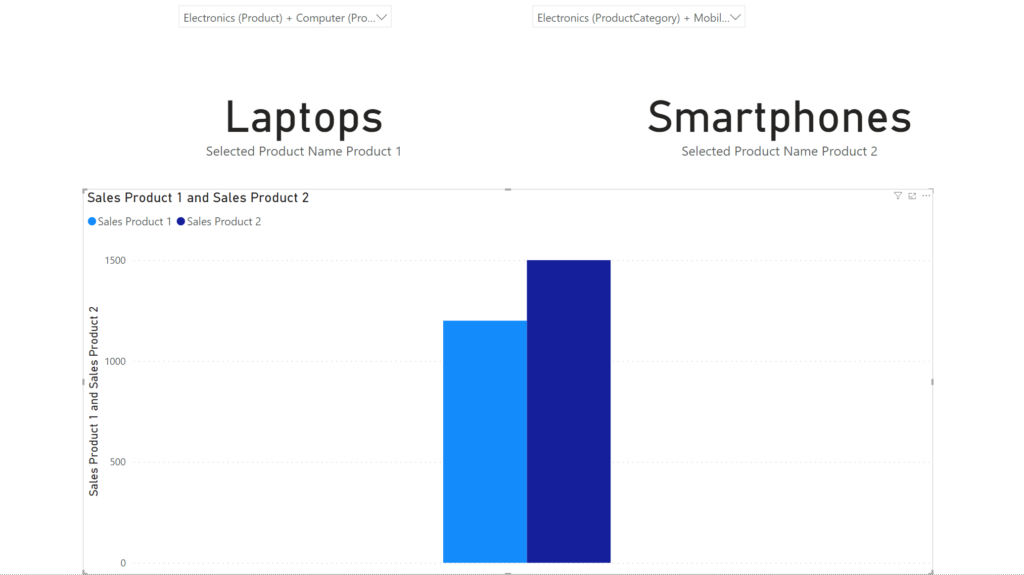
Here’s another example of how to use SELECTEDVALUE in a practical scenario.
I learned some of the things discussed in this blog post from Power BI Bootcamp: Zero to Mastery course. If You join the course I will earn a commission.