ISINSCOPE and advanced DAX functions in Power BI provide essential tools for marketers and data analysts aiming to dissect and understand data comprehensively. This guide delves into utilizing these sophisticated functions to scrutinize newsletter signup data across a 16-week timeline.
By mastering these capabilities, marketers can refine their strategies, ultimately enhancing the effectiveness of their campaigns through precise data analysis. This exploration highlights the strategic use of data-slicing techniques to extract pivotal insights that drive informed marketing decisions.
I learned some of the things discussed in this blog post from Power BI Bootcamp: Zero to Mastery course. If You join the course I will earn a commission.
Use Case Scenario
Imagine a scenario where a website, aiming to boost its user engagement, initiates several marketing campaigns to increase newsletter signups.
To understand which campaigns perform well, the marketing team uses Power BI to analyze the signups data collected over the past 16 weeks.
The goal is to identify trends and patterns in weekly and daily signups, which will inform future marketing strategies.
NB! You could easily use this DAX to analyze customer registrations or any other business scenario.
The Excel Dataset for ISINSCOPE and Advanced DAX

Before we can make use of our DAX formula and dive into the deep end – we need some sample data.
Luckily for you, I have prepared an Excel .xlsx file for you to use.
Import it to Power BI using the Excel get data option.
Explaining the DAX Formula for ISINSCOPE and Advanced DAX
The provided DAX formula facilitates a comprehensive analysis of new newsletter signups from two perspectives: weekly and daily averages. In addition, and here’s the tricky part, it also takes into account when we have the two granularities on one visual.
16 Week Avg New Newsletter Signups=
VAR LastDateContext = LASTDATE('Date'[Date])  -- Capture the last date from the current filter context
VAR StartDate = DATEADD(LastDateContext, -112 + 1, DAY)  -- Calculates the start date, 16 weeks (112 days) prior to the last date. You can also set the period to whatever you want. For example, -84 would use a 3 month (or 12 weeks) period which is often used.
VAR RelevantDates =
    DATESBETWEEN(
        'Date'[Date],
        StartDate,
        LastDateContext
    )  -- Create a list of dates between the start date and the last date
VAR WeeklySignups =
    CALCULATETABLE(
        SUMMARIZE(
            'Date',
            'Date'[Year],
            'Date'[Week_Name],  -- Groups by Week_Name within the given Year
            "WeeklySignups", [Count of New Signups]
        ),
        RelevantDates
    )  -- Summarize data to calculate the number of new signups registered each week within the relevant dates
VAR DailySignups =
    CALCULATETABLE(
        SUMMARIZE(
            'Date',
            'Date'[Year],
            'Date'[Date],  -- Groups by Date within the given Year
            "DailySignups", [Count of New Signups]
        ),
        RelevantDates
    )  -- Summarize data to calculate the number of new signups registered each day within the relevant dates

RETURN
    IF(
        ISINSCOPE('Date'[Week_Name]) && ISINSCOPE('Date'[Date]),
        AVERAGEX(DailySignups, [DailySignups]),  -- If both week and day columns are in the current context, calculate the average daily signups
        IF(
            ISINSCOPE('Date'[Week_Name]),
            AVERAGEX(WeeklySignups, [WeeklySignups]),  -- If only the week column is in the current context, calculate the average weekly signups
            IF(
                ISINSCOPE('Date'[Date]),
                AVERAGEX(DailySignups, [DailySignups]),  -- If only the day column is in the current context, calculate the average daily signups
                BLANK()  -- If neither context is applicable, return a blank result. For example, if the user somehow is looking at the year context. If the users want to start analyzing the yearly granularity - you need to add more conditions to the DAX code.
            )
        )
    )
Here’s a breakdown of the DAX formula
- Date Calculation Context:
LastDateContext: Captures the last date in the current filter context.StartDate: Computes the start date, exactly 16 weeks (or 112 days) before the last date.RelevantDates: Generates a list of dates between the start and last dates.
- Signup Summaries:
WeeklySignups: Calculates the total new signups for each week within the relevant date range. We are using the SUMMARIZE function in tandem with the CALCULATETABLE function to create a separate temporary table.DailySignups: Calculates the total new signups for each day within the relevant date range.
- Return Logic:
- Uses
ISINSCOPEto determine the context (day or week, or even both) and calculates the appropriate average (daily or weekly signups), providing a dynamic and contextual insight based on the user’s focus in Power BI.
- Uses
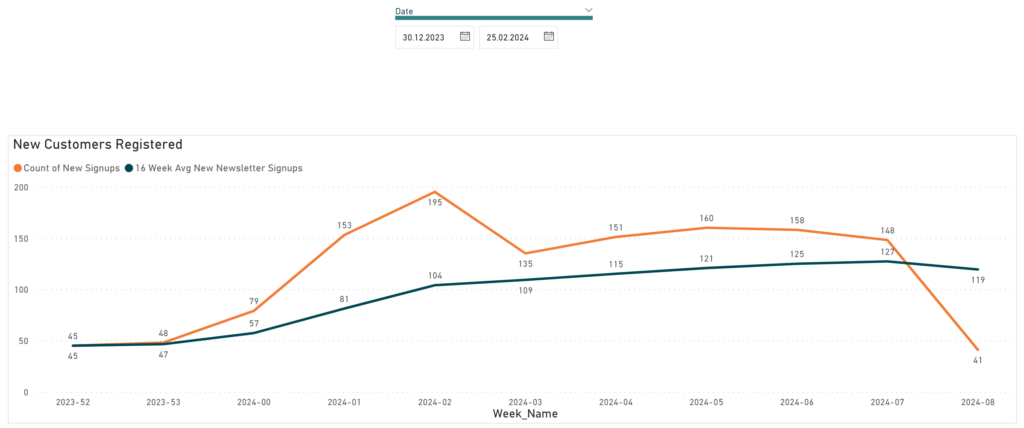
The End Result Using ISINSCOPE and Advanced DAX
If you perform some data transformations and tweak the Excel numbers, you should get something like this.
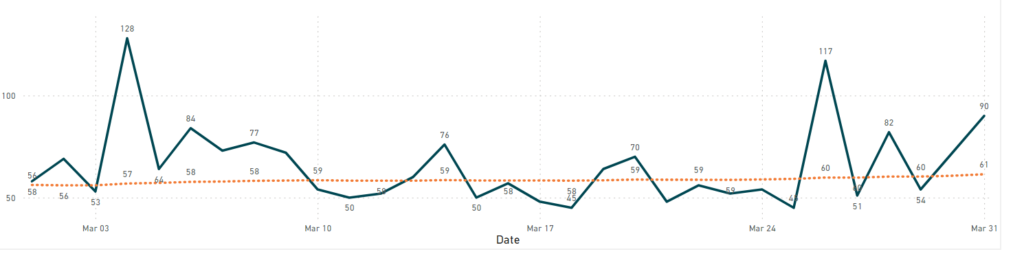
Or the daily view:
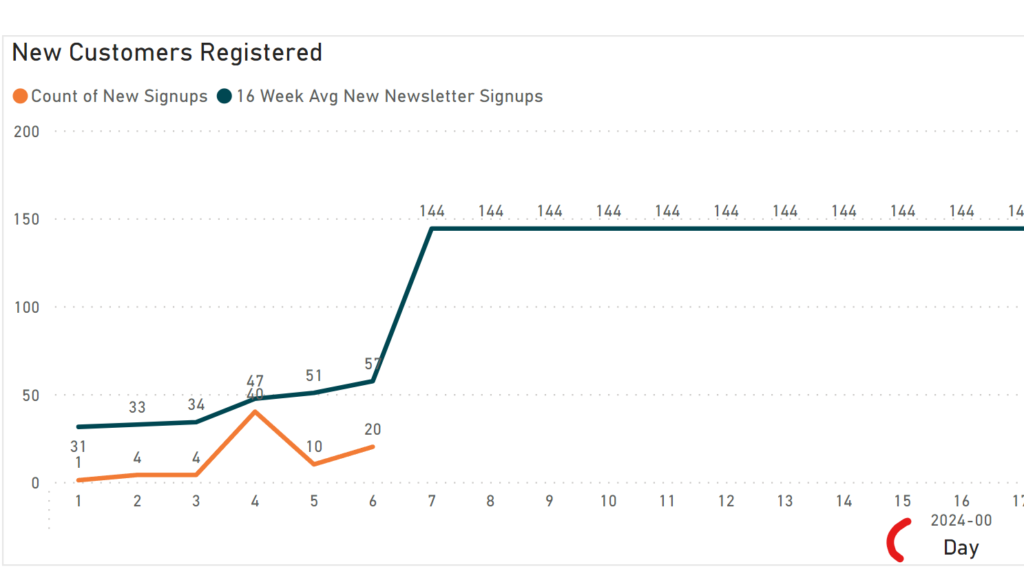
Or both together:
I learned some of the things discussed in this blog post from Power BI Bootcamp: Zero to Mastery course. If You join the course I will earn a commission.