Calculating MODE in DAX is a key statistical task when working with data in Power BI or other platforms that employ Data Analysis Expressions (DAX). Given that DAX lacks a native MODE function, it’s necessary to devise our own method for determining the most frequently occurring value in a dataset. This blog post will delve into custom solutions for calculating the mode, particularly within the context of working with a Fact table featuring two value columns and a Dimension (DIM) table that categorizes periods based on dates.
I learned some of the things discussed in this blog post from Power BI Bootcamp: Zero to Mastery course. If You join the course I will earn a commission.
The Problem
We need to display the most frequent value existing in the data set but we don’t have a built-in DAX function to do it.
And we have a date range in a DIM table to make the assignment even more complex.
The Solution to Calculating MODE in DAX
We have to divide our formula with some “DAX magic”.
I will give you the full formula here and will explain it line by line below.
Mode =
VAR FilteredData = //Filter the data so that we get the values for that period only
        FILTER(
        FactTable,
        FactTable[StartDate] >= MIN('Period'[DateDim]) &&
        FactTable[ToDate] <= MAX('Period'[DateDim]) &
    )
VAR FrequencyTable = SUMMARIZE( //Create a separate summarized table to calculate MODE
    FilteredData,
    FactTable[ValueColumn],
    "Frequency", COUNTA(FactTable[ValueColumn]) //Count all unique values and name them "Frequency" in the created column. The density number of all values is in the column. For example, if the price 10.50 exists 100 times, then the "ValueColumn" column has 10.50 and in the "Frequency" column there is 100.
)
VAR MaxFrequency = MAXX(FrequencyTable, [Frequency]) //Take the most frequently occurring value from the created interim table.
VAR ModeRows = FILTER(FrequencyTable, [Frequency] = MaxFrequency) //Filter the interim table so that the most frequently occurring value (MODE) is outputted.
RETURN MAXX(ModeRows, [ValueColumn]) //Show the user the most frequently occurring value, i.e., MODE
Calculating MODE in DAX Formula Explanation
I like to understand the formulas I’m using in my reports, especially if they are a tad more complicated.
That’s why I like to dissect them line by line for my ADHD brain to understand them. Don’t worry, I’m not diagnosed, my brain just works in “strange” ways.
VAR FilteredData = //Filter the data so that we get the values for that period only
        FILTER(
        FactTable,
        FactTable[StartDate] >= MIN('Period'[DateDim]) &&
        FactTable[ToDate] <= MAX('Period'[DateDim])
    )
When we declare the first variable, we are essentially prefiltering our data to only show the MODE for a certain period.
Imagine a date slicer where you can choose the period. Something like this:
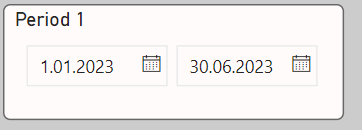
We are saying to the application that please take the dates that are greater or equal to the smallest date in the DateDim table (or in the first input of the slicer, in this case, 01.01.2023) from the FactTable[StartDate] column.
Then we are saying to the application that please take the dates that are smaller or equal to the greatest date in the DateDim table (or in the second input of the slicer, in this case, 30.06.2023) from the FactTable[ToDate] column.
This part is crucial if you have another period that you need to compare against. Which I did in a real-world scenario. But to keep things as simple as possible – I’m illustrating calculating the MODE with just one period and one value column.
Creating a Summarized Table for Calculating MODE in DAX
VAR FrequencyTable = SUMMARIZE( //Create a separate summarized table to calculate MODE
FilteredData,
FactTable[ValueColumn],
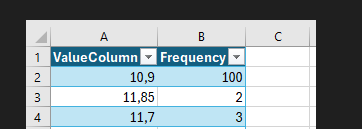
"Frequency", COUNTA(FactTable[ValueColumn]) //Count all unique values and name them "Frequency" in the created column. The density number of all values is in the column. For example, if the price 10.50 exists 100 times, then the "ValueColumn" column has 10.50 and in the "Frequency" column there is 100.
)We are creating another variable, and this is a Summarized table – a powerful feature of DAX that I invite you to read and learn more about.
Within the variable we are creating a separate table in the DAX ethers if you like. You can just imagine this table somewhere floating in DAX memory but it’s still a regular table. With columns and rows.
In it, we use our FilteredData variable to make sure we filter the data first, then we take our ValueColumn – the column where we would like to find the MODE.
And lastly, we create a new column in our imaginary table called “Frequency”. We also use the COUNTA built-in function to count all the unique values in our ValueColumn from the FactTable.
To illustrate this imaginary table even better, here are some screenshots:
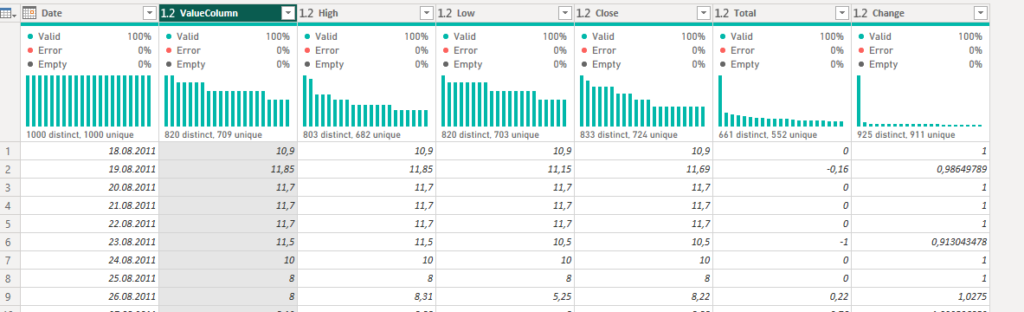
What we would get in our imaginary table (don’t worry, this is not directly created into your dataset):
Putting it all together to Calculate MODE in DAX
VAR MaxFrequency = MAXX(FrequencyTable, [Frequency]) //Take the most frequently occurring value from the created interim table.
VAR ModeRows = FILTER(FrequencyTable, [Frequency] = MaxFrequency) //Filter the interim table so that the most frequently occurring value (MODE) is outputted.
RETURN MAXX(ModeRows, [ValueColumn]) //Show the user the most frequently occurring value, i.e., MODE
We create two more variables. MaxFrequency uses the MAXX function to get the most frequently occurring value from the imaginary “Frequency” column. Or essentially the MODE.
Then we Filter the interim table and “Frequency” column with the MaxFrequency variable to get the final MODE output.
And there you have it, we are now masters of Calculating MODE in DAX!
I learned some of the things discussed in this blog post from Power BI Bootcamp: Zero to Mastery course. If You join the course I will earn a commission.