In this blog post, I’ll focus on the practical use of Pivot Unpivot and Transpose in Power BI Power Query, key tools for restructuring your data to better align with your analysis goals. We aim to share useful tips and insights to enhance your efficiency and understanding of these functions, making it easier to tailor your data for insightful analysis.
NB! To follow along with the exercises in this post, download this file here.
Understanding Pivot and Unpivot

Before we dive into the practicalities, let’s first understand what Pivot and Unpivot are:
- Pivot: This function transforms your data by rotating rows into columns. It’s useful when you want to summarize your data or when you have data in a vertical format that you want to present horizontally.
- Unpivot: This function does the opposite of Pivot. It transforms your data by rotating columns into rows. It’s beneficial when you have data in a horizontal format that you want to present vertically.
How to Pivot Data in Power Query
Let’s start with the Pivot function. Here are the steps to pivot data in Power Query:
- Load your data: Import your data into Power Query. You can do this by clicking on ‘Data’ in the top menu, then ‘Get Data’, and finally ‘From File’ or ‘From Database’, depending on your data source.
- Select the column to pivot: Click on the column header that you want to pivot. This will be the column that becomes your new headers.
- Pivot the column: Go to the ‘Transform’ tab and click on ‘Pivot Column’. A new window will open.
- Choose the values column: In the new window, select the column that contains the values you want to pivot. Then click ‘OK’.
- Check your data: Your data should now be pivoted. Check to make sure everything looks as expected.
Tips for Pivoting Data
- Use unique values: Make sure the column you’re pivoting has unique values. If there are duplicates, Power Query will aggregate them, which might not be what you want.
- Check your data types: Ensure that the values column contains numerical data if you’re planning to perform calculations on it.
- Keep an eye on performance: Pivoting can be resource-intensive if you’re working with large datasets. If you notice a slowdown, consider filtering your data before pivoting.
Practical Example of Pivoting Data in Power BI Power Query
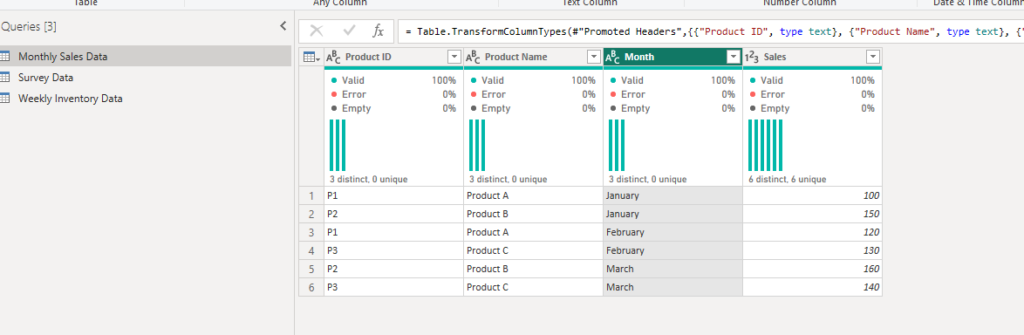
We have some sales data but we would love to see it in a much more clear way. We can use pivot here quite easily.
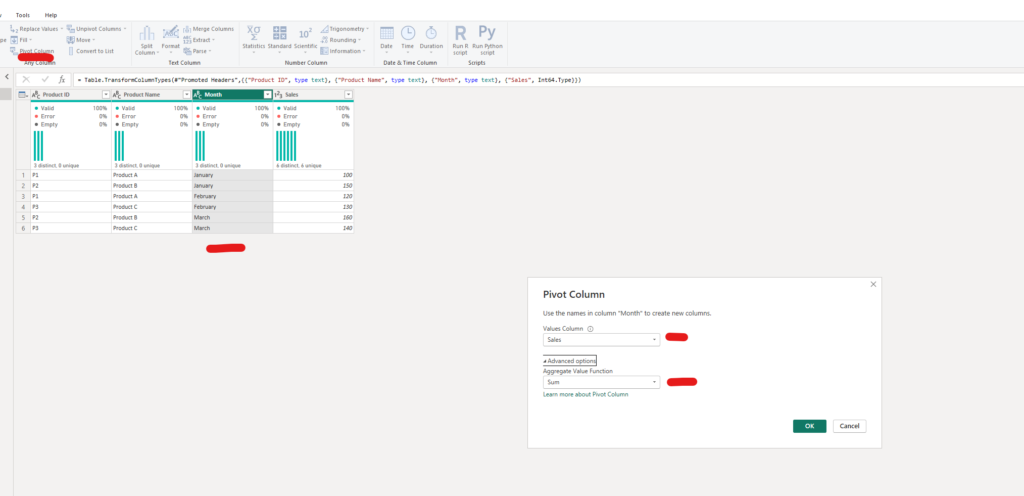
- Select the Month column and click on the Pivot Column.
- In the value column input > choose Sales.
- And SUM as aggregation.
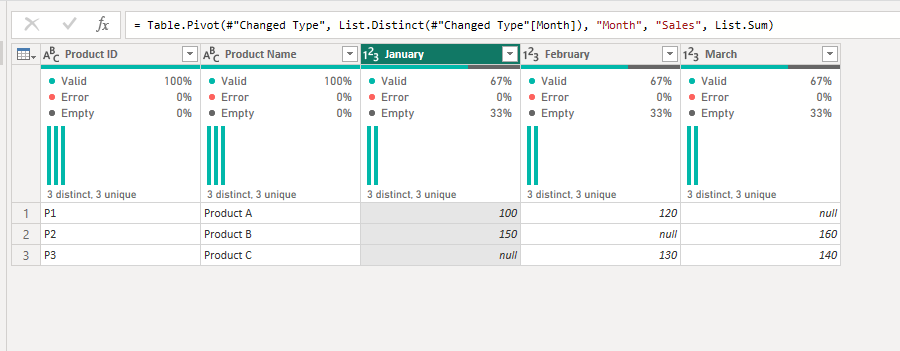
Now we can see the data per month much more clearly:
How to Unpivot Data in Power Query
Now, let’s move on to the Unpivot function. Here are the steps to unpivot data in Power Query:
- Load your data: As with pivoting, the first step is to import your data into Power Query.
- Select the columns to unpivot: Click on the column headers that you want to unpivot. These will be the columns that become your new rows.
- Unpivot the columns: Go to the ‘Transform’ tab and click on ‘Unpivot Columns’.
- Check your data: Your data should now be unpivoted. Check to make sure everything looks as expected.
Tips for Unpivoting Data
- Be selective: You don’t have to unpivot all your columns. You can select just the ones you need.
- Rename your columns: After unpivoting, Power Query will name your new columns ‘Attribute’ and ‘Value’. You can rename these to something more meaningful by right-clicking on the column header and selecting ‘Rename’.
- Watch out for null values: Unpivoting can create null values if your original data had empty cells. Be aware of this and handle these null values as necessary.
Practical Example of Unpivoting Data in Power BI Power Query
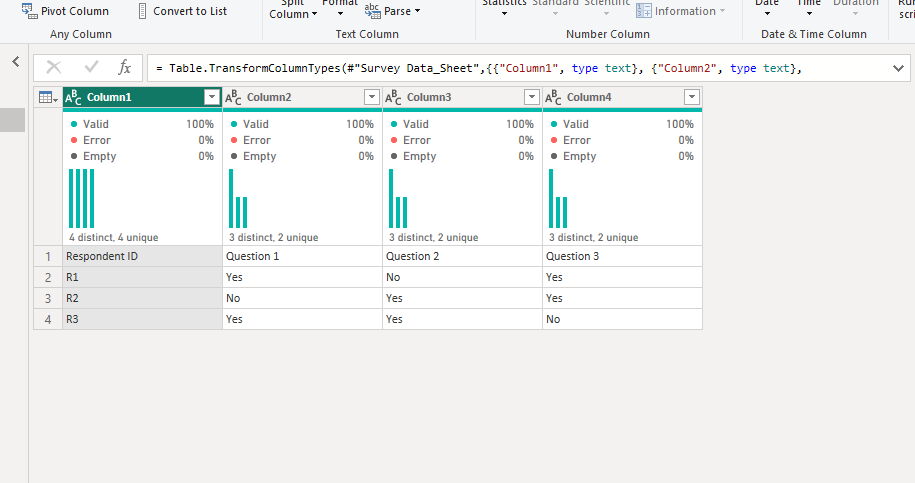
We have some survey data. How can we make it more readable? In comes unpivot!
- First, I promoted the headers because the data had an empty row.
- Then, we select the Question columns.
- The next step is to click on the Unpivot columns.
- Finally, give the new Value and Attribute columns a new name.
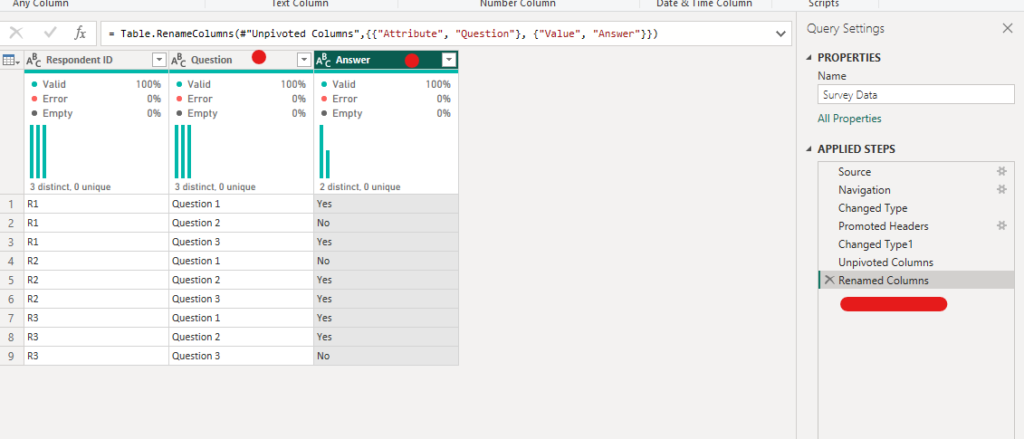
Now you should have something like this!
Understanding and Using Transpose in Power Query
Another powerful function in Power BI Power Query is the Transpose function. This function is somewhat similar to Pivot and Unpivot, but with a unique twist.
What is Transpose?
Transpose is a function that rotates your entire dataset, turning rows into columns and columns into rows. It’s like flipping your data on its side. This function is particularly useful when you have a dataset where the headers and values are misaligned, such as data that has been structured for presentation rather than analysis.
How to Transpose Data in Power Query
Here are the steps to transpose data in Power Query:
- Load your data: Import your data into Power Query, just as you would when pivoting or unpivoting.
- Select the data: Click anywhere inside your data. Unlike Pivot and Unpivot, you don’t need to select specific columns to transpose.
- Transpose the data: Go to the ‘Transform’ tab and click on ‘Transpose’. Your data will immediately be transposed.
- Check your data: Your data should now be transposed. Check to make sure everything looks as expected.
Tips for Transposing Data
- Check your headers: When you transpose data, the first row of your data will become your new headers. Make sure this row contains appropriate header information.
- Watch out for mismatched data types: If your rows contain different data types (for example, one row contains text and another contains numbers), transposing can lead to mismatched data types in your new columns.
- Keep an eye on performance: Like Pivot, Transpose can be resource-intensive with large datasets. If you notice a slowdown, consider filtering your data before transposing.
Practical Example of Unpivoting Data in Power BI Power Query
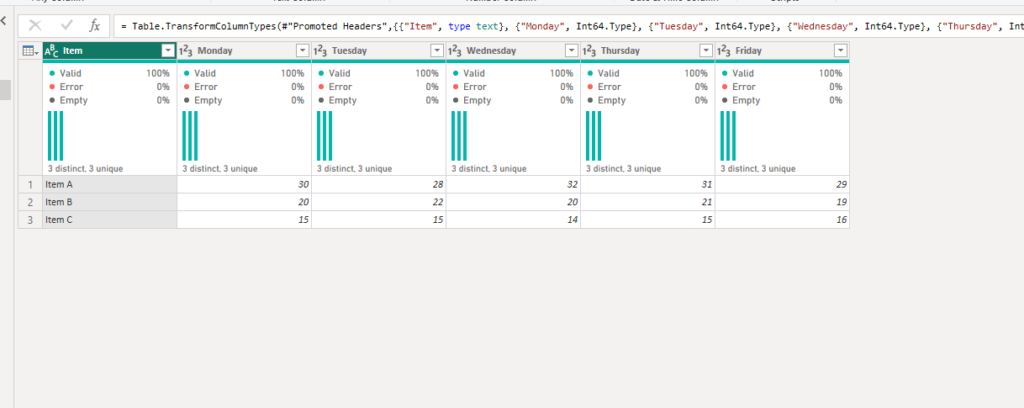
We have some weekly sales data per item. But we would like to see a better overview of it daily. In comes transpose.
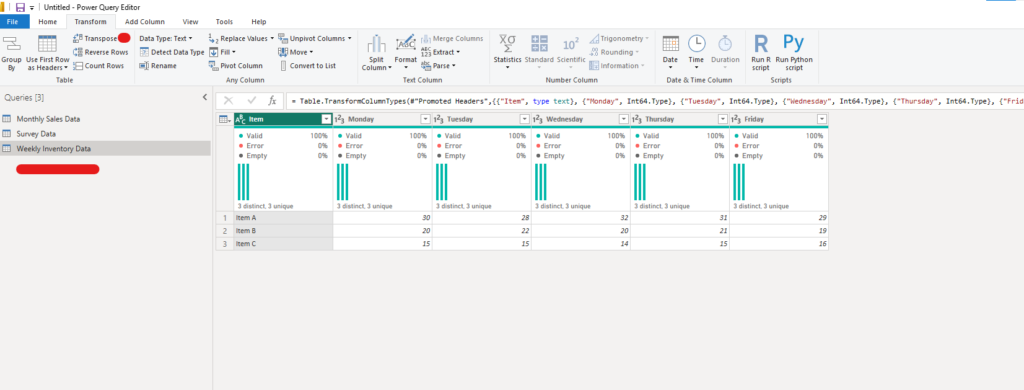
- Click on the table. Or click on the Item column.
- Click Transpose.
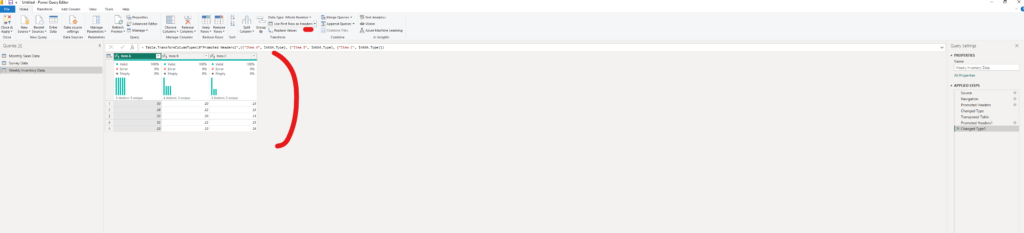
Now we need to promote headers and we are done! Daily inventory per item displayed in a more comprehensible way.
Summary of Pivot Unpivot and Transpose in Power BI Power Query
By now you should have a better understanding of Pivot, Unpivot, and Transpose in Power BI Power Query. The best way to master them – go get your hands muddy!