The power of data analysis lies in the ability to manipulate and transform data to suit your business requirements. The Data Analysis Expressions (DAX) language plays a pivotal role in helping you achieve this within Power BI. In this blog post, I will dive into a practical example, demonstrating how to create a SLAStandard column using the SWITCH and RELATED functions. By the end of this post, you will gain a deeper understanding of these powerful functions and their applications.
The following was an exercise in the Power BI Bootcamp: Zero to Mastery course. It was one of the most difficult exercises in the Bootcamp and I thought I share this with You because it offers a nice real-life scenario. If You join the course I will earn a commission.
Understanding the SWITCH Function

The SWITCH function is a versatile tool that enables you to perform conditional calculations and return values based on specific conditions.
This function simplifies complex nested IF statements, making your DAX formulas more readable and efficient.
The key benefit of the SWITCH function lies in its ability to handle multiple conditions, resulting in more concise and streamlined formulas.
The Power of the RELATED Function

When working with multiple tables in Power BI, it is often necessary to retrieve related data from another table.
The RELATED function comes into play, allowing you to access data from a related table through a pre-established relationship.
By utilizing this function, you can enrich your analysis by combining relevant information across different tables.
Crafting the SLAStandard Column Formula

In our example, we use both the SWITCH and RELATED functions to create a SLAStandard column in the Shipments table.
Our goal is to determine the SLA standard for each shipment based on customer loyalty and subscription plans.
To achieve this, we first create variables to store the values from the Customers table using the RELATED function.
Then, we implement the SWITCH function to manage multiple conditions and return the appropriate SLA standard. This combination of functions allows us to efficiently and accurately derive the desired results.
Explaining the DAX formula using SWITCH and RELATED functions
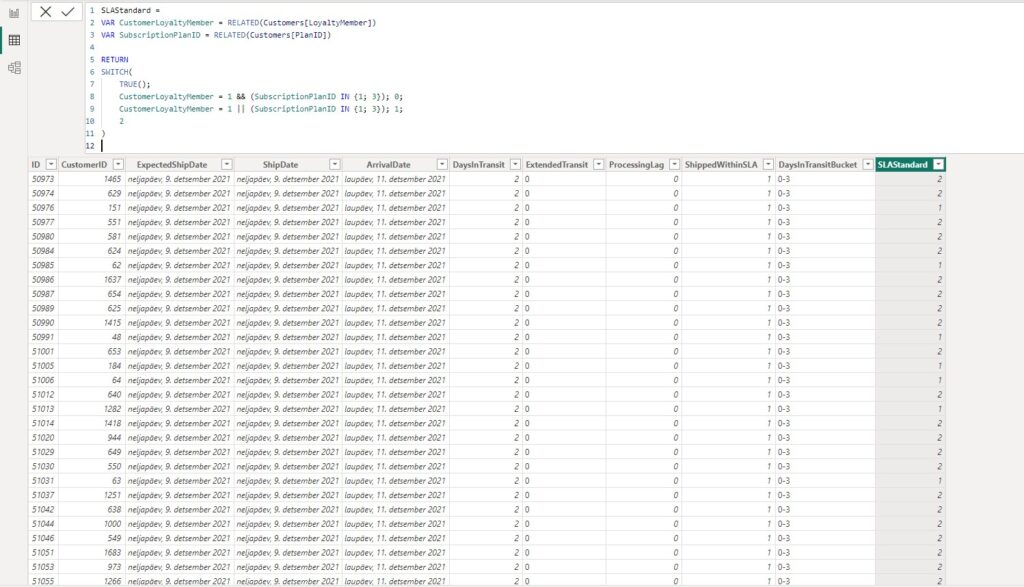
SLAStandard =

VAR CustomerLoyaltyMember = RELATED(Customers[LoyaltyMember])
VAR SubscriptionPlanID = RELATED(Customers[SubscriptionPlanID])

RETURN
SWITCH(
    TRUE(),
    CustomerLoyaltyMember = 1 && (SubscriptionPlanID IN {1, 3}), 0,
    CustomerLoyaltyMember = 1 || (SubscriptionPlanID IN {1, 3}), 1,
    2
)
Here’s what the formula does:
- We first create two variables:
CustomerLoyaltyMemberandSubscriptionPlanIDusing the RELATED function to retrieve the respective values from the Customers table. - We use the SWITCH function with the TRUE() parameter to handle multiple conditions.
- We check if
CustomerLoyaltyMemberis equal to 1 andSubscriptionPlanIDis either 1 or 3 using the IN operator. If both conditions are met, the formula returns 0. You can also see the && operator being used to check the conditions. - If the customer is a Loyalty Member OR subscribes to subscription plans 1 or 3 (but not both), the formula returns 1. We use the || (OR) operator to check for either condition.
- For all other cases, the formula returns 2.
The result of the DAX formula in Power BI
Some of You might be asking – what did we actually achieve by creating this formula?
In this real-life scenario, the business has different SLA standards for different types of customers.
They have certain specifications in order for the customer to qualify for a higher SLA standard. For example, the customer has to be a member of the loyalty service. And subscribed to a specific subscription plan.
The problem for us in preparing the dataset – the logic wasn’t written anywhere into the data. And all of the data was in different tables.
In these types of situations, we as data analysts have to create the logic in our queries or formulas. Usually adding a few columns at the same time. All the while pulling data from various tables.
Enhancing Your Data Analysis Skills With Switch and Related Functions

Mastering DAX functions like SWITCH and RELATED is essential for any data analyst working with Power BI. These functions enable you to create powerful and dynamic formulas that can handle complex scenarios, providing you with the flexibility and control needed for robust data analysis.
The following was an exercise in the Power BI Bootcamp: Zero to Mastery course. It was one of the most difficult exercises in the Bootcamp and I thought I share this with You because it offers a nice real-life scenario. If You join the course I will earn a commission.